Payroll KPIs: definition, top metrics, benefits, and tracking techniques
Robbin Schuchmann
Co-founder, Employ Borderless
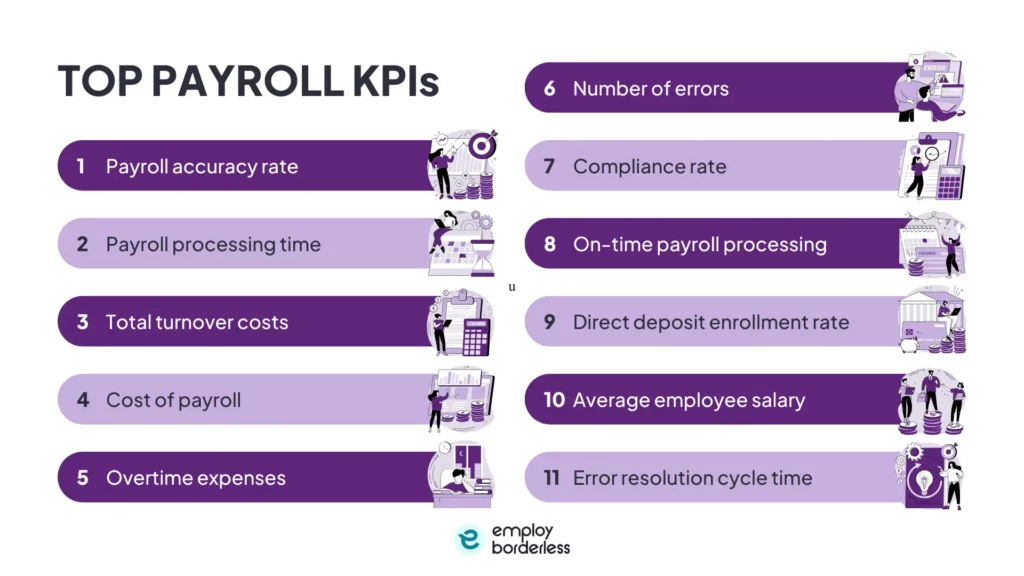
Payroll KPIs are measurable metrics that track the accuracy, efficiency, cost, and compliance of your payroll operations. A metric tracks a specific aspect of payroll (like errors per cycle). A KPI is a metric tied to a strategic goal (like payroll accuracy rate held above 99%). The most important payroll KPIs are payroll accuracy rate, payroll processing time, cost per payroll transaction, overtime as a percentage of total pay, payroll-to-revenue ratio, on-time payment rate, off-cycle payment rate, and error resolution cycle time. Each KPI needs a specific formula, a benchmark target, and a defined measurement frequency.
Payroll is typically the largest operating expense for most businesses, accounting for up to 50% to 70% of total operating costs. The IRS estimates approximately 40% of small to medium-sized businesses incur a payroll penalty each year (cited by Paychex and others). A December 2022 EY analysis (commissioned by Paycom) of 508 US companies with 250 to 10,000 employees found the average payroll accuracy rate was just 80%, with companies making an average of 15 corrections per pay period. Yet according to the State of Payroll Study cited by HiBob, 50% of payroll professionals don't track KPIs at all. Measuring these metrics turns vague concerns about payroll quality into specific, data-driven answers.
The downstream impact is real. ADP's People at Work 2022 survey of more than 32,000 workers globally found that 23% said they are always or often paid late, and 24% said they are always or often underpaid. Pay errors directly affect employee satisfaction, retention, and trust. Even a small error can trigger disproportionate frustration.
This guide defines each payroll KPI, provides the formula for calculating it, gives a benchmark target, and explains what the results mean for your business.
- Average payroll accuracy rate: 80% across 508 US companies surveyed in the 2022 EY/Paycom analysis - against an industry target of above 99%.
- Average corrections per pay period: 15 per company, per the same EY/Paycom study.
- IRS penalty exposure: approximately 40% of small to medium-sized businesses incur a payroll penalty each year.
- Off-cycle payment benchmark: Deloitte's Global Payroll Benchmarking Survey found respondents averaged 0.23 off-cycle payments annually per employee globally; target is under 2% of total transactions.
- Payroll processing time benchmark: APQC benchmarks suggest fully automated payroll for a mid-sized company (50 to 500 employees) should take under 3 hours per cycle; manual payroll commonly exceeds 8 to 10 hours.
Which payroll KPIs should you track?
The core payroll KPIs cover two dimensions. Operational KPIs (accuracy, processing time, on-time rate, off-cycle rate, error resolution time) measure whether payroll is executed correctly each cycle. Strategic KPIs (cost per transaction, overtime percentage, payroll-to-revenue ratio, total payroll cost, payroll leakage) measure whether payroll is financially sustainable over time. All payroll KPIs should follow the SMART principle. They should be Specific, Measurable, Achievable, Relevant, and Time-bound.
One important distinction before using these formulas. A "payroll run" is a single pay cycle for the entire company. A "payroll transaction" is an individual paycheck or direct deposit within that run. A company running biweekly payroll with 100 employees has 26 payroll runs per year but 2,600 payroll transactions per year. The formulas below specify which unit they use.
KPI | Formula | Benchmark | What It Tells You |
Payroll accuracy rate | (Total transactions - transactions with errors) / total transactions x 100 | Above 99% (transaction-level) | Whether employees are paid correctly each cycle |
Payroll processing time | Total hours from data collection to payment disbursement per cycle | Under 3 hours (automated, mid-size) | How efficient your payroll workflow is |
Cost per payroll transaction | Total payroll admin costs / number of paychecks issued per period | Under $10 per check | The operational cost of processing each payment |
Overtime as % of total pay | Total overtime pay / total gross payroll x 100 | Under 5% | Whether overtime is controlled or signals staffing gaps |
Payroll-to-revenue ratio | Total payroll cost / total revenue x 100 | 15%-35% (varies by industry) | Whether labor costs are sustainable relative to revenue |
On-time payment rate | Employees paid on scheduled date / total employees x 100 | Target 100%; investigate at 99% or below | Whether every employee is paid on schedule |
Off-cycle payment rate | Number of off-cycle payments / total transactions x 100 | Under 2% | How often errors force manual corrections |
Error resolution cycle time | Average days from error discovery to resolution | 1-2 business days (recommended target); APQC reports 2-10 days average | How quickly your team corrects payroll mistakes |
How do you measure payroll accuracy?
Payroll accuracy rate measures the percentage of individual payroll transactions (paychecks) processed without errors, and it's the most critical operational payroll KPI because every other metric depends on getting pay right.
The formula is (total payroll transactions - transactions containing errors) / total payroll transactions x 100. An error is any transaction that requires a correction, reissue, off-cycle payment, or retroactive adjustment. This includes incorrect tax withholdings, missed deductions, wrong hours, duplicate payments, and misapplied pay rates.
Industry targets generally aim for above 99% accuracy at the transaction level. The EY/Paycom analysis found average accuracy of approximately 80% across 508 US companies, suggesting most organizations have significant room for improvement. Mature payroll teams track both the initial error rate (errors caught before payment, at the pre-audit stage) and the final error rate (errors that made it through to employee paychecks). The pre-audit error rate is usually higher, but the final error rate determines employee impact and compliance exposure.
Track error types separately to improve accuracy. If most errors are wrong hours, the problem is time tracking. If most errors are tax withholding mistakes, the problem is your payroll system's tax table updates. If most errors are missed deductions, the problem is benefit enrollment data not syncing with payroll.
How do you measure error resolution cycle time?
Error resolution cycle time measures the average time it takes to resolve a payroll error from the moment it's discovered to when it's fully corrected and the employee receives the right payment./strong> According to an APQC study cited by HiBob, it takes companies between 2 and 10 days to resolve a payroll error. A recommended target for mature payroll teams is 1 to 2 business days. Teams consistently averaging 5 or more days should investigate their resolution process for bottlenecks.
Track error resolution time by error type. Tax miscalculations, incorrect deductions, and underpayments each have different resolution paths and different urgency levels. A systematic underpayment affecting multiple employees requires faster resolution than a single data entry error on one paycheck. Also track whether errors are resolved within the current pay cycle or carry over to the next - carryover errors create compounding reconciliation problems.
How do you measure payroll processing time?
Payroll processing time measures the total hours your team spends on each payroll cycle, from initial data collection (hours, salary changes, new hires, terminations) through final payment disbursement and tax filing.
Measure this by having everyone involved in payroll (HR, finance, approvers) log their time for each step across three consecutive pay periods. The average gives you your baseline. Break the total into four stages: data collection and verification, calculation and review, approval and submission, and post-payroll reporting and reconciliation. This breakdown shows where time is being spent and where automation would have the biggest impact.
APQC benchmarks suggest that fully automated payroll for a mid-sized company (50 to 500 employees) should take under 3 hours per cycle from data lock to payment file submission. Manual payroll for the same size company commonly exceeds 8 to 10 hours per cycle. ADP's Global Payroll Survey data indicates that roughly three-quarters of organizations still run multiple payroll systems across multiple geographies, which adds significant processing time. Deloitte's Global Payroll Benchmarking Survey found that more than 25% of respondents said their payroll processes are mainly manual and that staff spend the most time on reconciliation, audits, controls, and data entry. If your processing time is well above these benchmarks, it usually points to manual data entry, paper-based approvals, or disconnected systems that require re-keying data between HR and payroll platforms.
How do you calculate cost per payroll transaction?
Cost per payroll transaction measures the total administrative cost of issuing each paycheck, including labor time, software costs, third-party fees, and error correction costs.
The formula is total payroll administration costs / total number of paychecks issued per period. Include payroll staff salaries (prorated for time spent on payroll), payroll software subscription fees, outsourced payroll provider fees, printing and distribution costs (if applicable), and the cost of correcting errors (staff time for reissues, penalty costs). Divide by the total number of individual paychecks or direct deposits processed.
Per-paycheck costs vary by business size and method. Enterprise companies using automated payroll at scale often achieve $2 to $5 per check. Small businesses (under 50 employees) using providers like Gusto, ADP Run, or QuickBooks Payroll typically pay $6 to $15 per check when the base subscription fee is included. Companies processing payroll fully manually typically spend $15 to $25+ per check in staff time alone. If your cost per transaction is trending upward quarter over quarter, investigate whether error correction costs, overtime in the payroll team, or provider fee increases are driving the change.
What is the total payroll cost and why should you track it?
Total payroll cost is the complete expense your company incurs for compensating employees, including salaries, benefits, bonuses, employer taxes, and administrative costs. This is distinct from "cost per transaction" (which measures processing efficiency) and "payroll-to-revenue ratio" (which measures sustainability). Total payroll cost measures absolute spend.
Many companies can't forecast payroll costs three months out or break down costs at the department level. To calculate it, add up all payroll-related expenses over a given period, then compare against revenue or budgeted payroll costs. Track by department, location, and employee type (full-time, part-time, contractor) to identify where costs are concentrated.
What is the payroll-to-revenue ratio?
The payroll-to-revenue ratio measures total payroll costs (including employer taxes and benefits) as a percentage of total revenue, and it's the most useful strategic payroll KPI because it shows whether your labor costs are sustainable relative to what the business earns.
The formula is total payroll cost / total revenue x 100. Include gross wages, employer FICA, FUTA, SUI, workers' compensation, health insurance, retirement contributions, and all other employer-paid compensation costs. Note that this ratio measures payroll against revenue, not against total operating costs. The two denominators produce very different numbers and shouldn't be confused.
Typical benchmarks by industry are 15% to 20% for manufacturing, 20% to 35% for technology and SaaS (lower end for mature companies, higher for growth-stage), 25% to 35% for professional services, 30% to 45% for healthcare (varies significantly by subsector), and 25% to 35% for restaurants and hospitality (per National Restaurant Association data for full-service restaurants; fast-food typically runs lower). If your ratio is above your industry benchmark, it could mean you're overstaffed, paying above-market rates, carrying excessive overtime costs, or that revenue hasn't grown proportionally to headcount. Track this quarterly to catch trends early.
How do you measure overtime as a percentage of total pay?
Overtime as a percentage of total pay measures how much of your total payroll spend goes to overtime compensation, and it's both a cost control metric and a workforce planning signal.
The formula is total overtime pay / total gross payroll x 100. A healthy target is under 5% of total payroll. If overtime consistently exceeds 5%, it may indicate understaffing in specific departments, poor scheduling practices, or employees who depend on overtime income and structure their work to generate it.
Track overtime by department, not just company-wide. Company-wide overtime of 4% might look healthy, but if one department is running at 15% while the rest are at 1%, that department has a staffing problem. Also compare overtime costs against the fully loaded cost of hiring an additional employee using hours, not just dollars. If a department is running 100 hours/month of overtime at $30/hour (1.5x a $20/hour base rate), that costs $3,000/month. A new $40,000/year employee costs approximately $48,000 to $55,000 fully loaded (after adding employer FICA, unemployment taxes, workers' comp, and benefits), or roughly $4,000 to $4,600/month for approximately 173 hours of labor. The full-time hire gives you 73 additional hours per month for $1,000 to $1,600 more in cost, but only if you actually need those additional hours. If overtime covers legitimate, variable demand rather than consistent excess workload, a full-time hire creates idle capacity. Run the math on your specific situation before assuming a new hire replaces overtime dollar for dollar.
What is payroll leakage?
Payroll leakage is the unintended or unnecessary payroll expenses that occur due to errors, fraud, or inefficiencies. Many payroll teams fail to analyze where money is lost in the payroll process. Measuring payroll leakage helps companies identify preventable financial losses and improve forecasting.
To measure payroll leakage, audit payroll records regularly to detect discrepancies or overpayments. Compare actual payroll costs against budgeted or forecasted amounts. Track error correction trends, such as retroactive adjustments, reversals, or manual overrides. Analyze payroll exceptions (unusually high payments, one-off bonuses without approvals, duplicate payments). The gap between what you budgeted and what you actually paid, after removing legitimate changes, is your leakage. Monitoring for payroll fraud is a critical component of leakage prevention, especially in multi-country setups where segregation of duties and audit trails must work across different systems and currencies.
How do you track payroll compliance?
Payroll compliance KPIs measure whether your payroll operations meet federal, state, and local regulatory requirements, including timely tax deposits, accurate W-2 and 1099 filings, correct application of wage and hour laws, and data privacy requirements for employee payroll information.
The simplest compliance metric is a binary pass/fail checklist for each pay period. Did all Form 941 deposits go out on time? Were all state tax withholdings applied correctly? Were new hires reported within the required timeframe? Were any penalties received from the IRS or state agencies? A more sophisticated approach assigns a compliance score, where each requirement is weighted by severity (IRS trust fund penalties are weighted higher than late internal reporting) and the overall score is calculated as a percentage of total compliance obligations met.
Track compliance violations by root cause, not just occurrence. If most violations are late deposits, the problem is cash flow management or an approval bottleneck. If most violations are wrong tax rates, the problem is system configuration or failure to update tax tables. Effective risk management in payroll starts with tracking compliance violations consistently and investigating any cycle where they fall outside acceptable ranges.
What is the off-cycle payment rate and why does it matter?
The off-cycle payment rate measures how often your payroll team processes payments outside the regular payroll schedule, including correction runs, retroactive adjustments, missed payments, and manual check requests.
The formula is the number of off-cycle payments / total payroll transactions x 100. A target of under 2% is a reasonable starting point. Deloitte's Global Payroll Benchmarking Survey found that respondents averaged 0.23 off-cycle payments annually per employee globally. Off-cycle payments are expensive because they bypass normal approval workflows, often require manual processing, and create reconciliation headaches at month-end. Each off-cycle run typically costs 3 to 5 times more in staff time than a transaction processed in the regular payroll cycle.
A rising off-cycle rate is a leading indicator of deeper problems. It usually means upstream data (hours, rates, deductions, new hire information) isn't reaching the payroll team accurately or on time, forcing corrections after the regular run. Track off-cycle payments by cause category (late data submission, manager approval delays, system errors, employee disputes) to identify where the upstream process is failing.
What other metrics should payroll teams monitor?
Beyond the core operational and strategic KPIs, several additional metrics provide workforce planning insights that directly affect payroll costs.
Employee leave and absenteeism
Tracking when employees take leave helps identify popular vacation periods and plan payroll accordingly. Monitoring absenteeism patterns can reveal underlying issues (burnout, disengagement, health problems) that affect both payroll costs and productivity. Companies absorb the cost of all employee leave, but well-rested employees offer higher productivity that offsets the cost, making tracking the balance essential.
Training and onboarding costs
Every new hire creates payroll costs before they reach full productivity. Track the time and cost to onboard each new employee, including training wages, reduced output during ramp-up, and the administrative cost of payroll setup. This metric connects directly to turnover, since high turnover means repeatedly incurring these costs.
Annual turnover rate
Payroll management and employee retention are directly linked. Fair compensation, timely payments, and transparent pay structures all affect whether employees stay. Track the percentage of employees who leave within a year and cross-reference with payroll accuracy and on-time payment data to identify whether payroll issues are contributing to attrition.
Direct deposit enrollment rate
This metric measures the percentage of employees who opt for direct deposit. Higher enrollment reduces paper check costs, eliminates distribution delays, and improves employee satisfaction with the payment process. A low enrollment rate may indicate employees lack trust in the payroll system or haven't been educated about the option.
Response time for payroll queries
As automation handles routine payroll tasks, the payroll manager's role increasingly shifts toward internal consulting. Track how quickly the payroll team responds to data requests from leadership, managers, and employees. This metric measures the team's capacity to serve as a strategic resource rather than just a processing function.
What are payroll KPI examples?
Payroll KPI examples include both operational indicators - such as payroll accuracy rate, on-time payment rate, off-cycle payment rate, and error resolution cycle time - and strategic indicators such as cost per payroll transaction, overtime as a percentage of total pay, and payroll-to-revenue ratio. Each example below shows the indicator, its formula, and a benchmark target.
- Payroll accuracy rate (operational indicator): (Total transactions - transactions with errors) / total transactions x 100. Target: above 99%.
- On-time payment rate (operational indicator): Employees paid on scheduled date / total employees x 100. Target: 100%; investigate at 99% or below.
- Off-cycle payment rate (operational indicator): Off-cycle payments / total transactions x 100. Target: under 2%.
- Error resolution cycle time (operational indicator): Average days from error discovery to resolution. Target: 1-2 business days.
- Cost per payroll transaction (strategic indicator): Total payroll admin costs / paychecks issued. Target: under $10 per check.
- Overtime as % of total pay (strategic indicator): Total overtime pay / total gross payroll x 100. Target: under 5%.
- Payroll-to-revenue ratio (strategic indicator): Total payroll cost / total revenue x 100. Target: 15%-35% depending on industry.
How do you build a payroll KPI dashboard?
A payroll KPI dashboard consolidates your key metrics into a single view that your payroll team, finance team, and leadership can review regularly. The dashboard should update automatically from your payroll system data rather than requiring manual data entry.
Start with the core KPIs in the table above. Display each as a current value with a trend indicator (improving, stable, declining) and a comparison against your benchmark target. Add a 12-month trend line for each metric to show directional movement. The dashboard should flag any KPI that falls outside its acceptable range so your team can investigate before the next payroll cycle. Payroll analytics tools within modern payroll platforms can generate these dashboards automatically from your payroll data.
Most modern payroll systems include built-in reporting capabilities. If your current system doesn't, payroll data can be exported to business intelligence tools like Excel, Google Sheets, Power BI, Looker, or Tableau. The key is consistency - update the dashboard after every payroll cycle and review it monthly with your team.
Pair the dashboard with regular payroll audits to validate that the data feeding your KPIs is accurate and complete.
How do you implement payroll KPIs?
Setting up payroll KPIs requires buy-in from both HR and payroll, clean data, and a commitment to regular review.
Enable data sharing between payroll and HR: Systems need to be integrated for HR and payroll to align. Evaluate whether your existing systems support integration or whether it's time to find a provider that connects your HRIS and payroll data. Disconnected systems are the single biggest barrier to meaningful KPI tracking.
Start with three KPIs: Don't try to track everything at once. Begin with accuracy rate, processing time, and on-time payment rate. These three provide the foundation for all other payroll metrics. Add strategic KPIs (payroll-to-revenue, overtime, total cost) once the operational KPIs are stable.
Ensure buy-in from both teams: For a true partnership, HR and payroll need to agree on what they're measuring and why. The measurement should be used for improvement, not blame. Teams are more likely to adopt a data-driven approach if they know it's used to collaborate and improve, not to assign fault for errors.
Share quarterly updates: Don't keep payroll metrics internal to the payroll team. Share them with senior leadership through quarterly updates. Payroll and HR data are essential decision-making points for executives. Help them stay informed so they can influence operational and organizational changes as needed.
Set benchmarks and iterate: Note your starting point, define targets, and track progress toward milestones. Benchmarks should be reviewed annually and adjusted based on business growth, system changes, and industry shifts. According to EY survey results, a third of organizations view very high or complete standardization as a positive driving force that significantly improves payroll operations.
What is a good payroll accuracy rate?
A good payroll accuracy rate is above 99% at the transaction level, meaning fewer than 1 in 100 individual paychecks contains an error that requires correction. Industry targets generally aim for 99%+ accuracy, though the EY/Paycom analysis from 2022 found average actual accuracy of approximately 80% across 508 surveyed US companies, suggesting significant room for improvement in most organizations.
How often should you review payroll KPIs?
Review operational payroll KPIs (accuracy, on-time rate, off-cycle payments, error resolution time) after every payroll cycle, and review strategic KPIs (payroll-to-revenue ratio, overtime trends, cost per transaction, total payroll cost) monthly or quarterly. Annual reviews are useful for setting new benchmark targets and evaluating year-over-year improvement. Understanding the payroll history behind your organization's metrics helps contextualize trends and set realistic improvement targets.
What payroll KPIs matter most for small businesses?
For small businesses, the three most impactful payroll KPIs are accuracy rate, on-time payment rate, and payroll-to-revenue ratio. Small businesses typically have less margin for error, so accuracy and timeliness prevent penalties that can be disproportionately expensive.
How do payroll KPIs differ for multi-country employers?
Multi-country payroll KPIs add two additional dimensions. Compliance must be tracked per country (since each jurisdiction has different tax rules and filing deadlines), and accuracy should be measured separately for each country to identify which locations create the most errors. Companies using an EOR, In-Country Provider (ICP), or managed global payroll provider should also track provider SLA adherence as a KPI, measuring whether the provider meets its contractual accuracy and timeliness commitments in each country.
What is payroll leakage, and how do you measure it?
Payroll leakage is the gap between what you budgeted for payroll and what you actually paid, after removing legitimate changes like new hires and raises. It captures unintended expenses from errors, fraud, overpayments, duplicate payments, and process inefficiencies. Measure it by comparing actual payroll costs against forecasted amounts, tracking retroactive adjustments and manual overrides, and auditing payroll exceptions. The resulting figure is your preventable financial loss.

Co-founder, Employ Borderless
Robbin Schuchmann is the co-founder of Employ Borderless, an independent advisory platform for global employment. With years of experience analyzing EOR, PEO, and global payroll providers, he helps companies make informed decisions about international hiring.
Learning path · 10 articles
Payroll fundamentals
Master the fundamentals with our step-by-step guide.
Start the pathReady to hire globally?
Get a free, personalized recommendation for the best EOR provider based on your needs.
Get free recommendations